Seniors Housing Occupancy Continued to Improve In August Reporting Period
September 17, 2021
The path to recovery is never a straight line. While the Delta variant has changed the narrative once again and reportedly affected move-in rates in some seniors housing properties, overall occupancy and demand seem to be experiencing positive momentum.
[Note: this blog was updated as of September 17, 2021 to reflect revised data.]
Seniors Housing Intra-Quarterly Occupancy
The recently released NIC Intra-Quarterly Snapshot report shows that the overall occupancy rate for seniors housing increased to 79.9% in the August 2021 reporting period (June-July-August 2021) for the NIC MAP Primary Markets on a three-month rolling basis, according to Intra-Quarterly NIC MAP Data, released by NIC MAP Vision. This was an eight-month high and placed the all-occupancy rate 1.2 percentage points above its record low of 78.7% in the June 2021 reporting period. Notably, it was 7.5 percentage points below its pre-pandemic level of 87.4%, however.
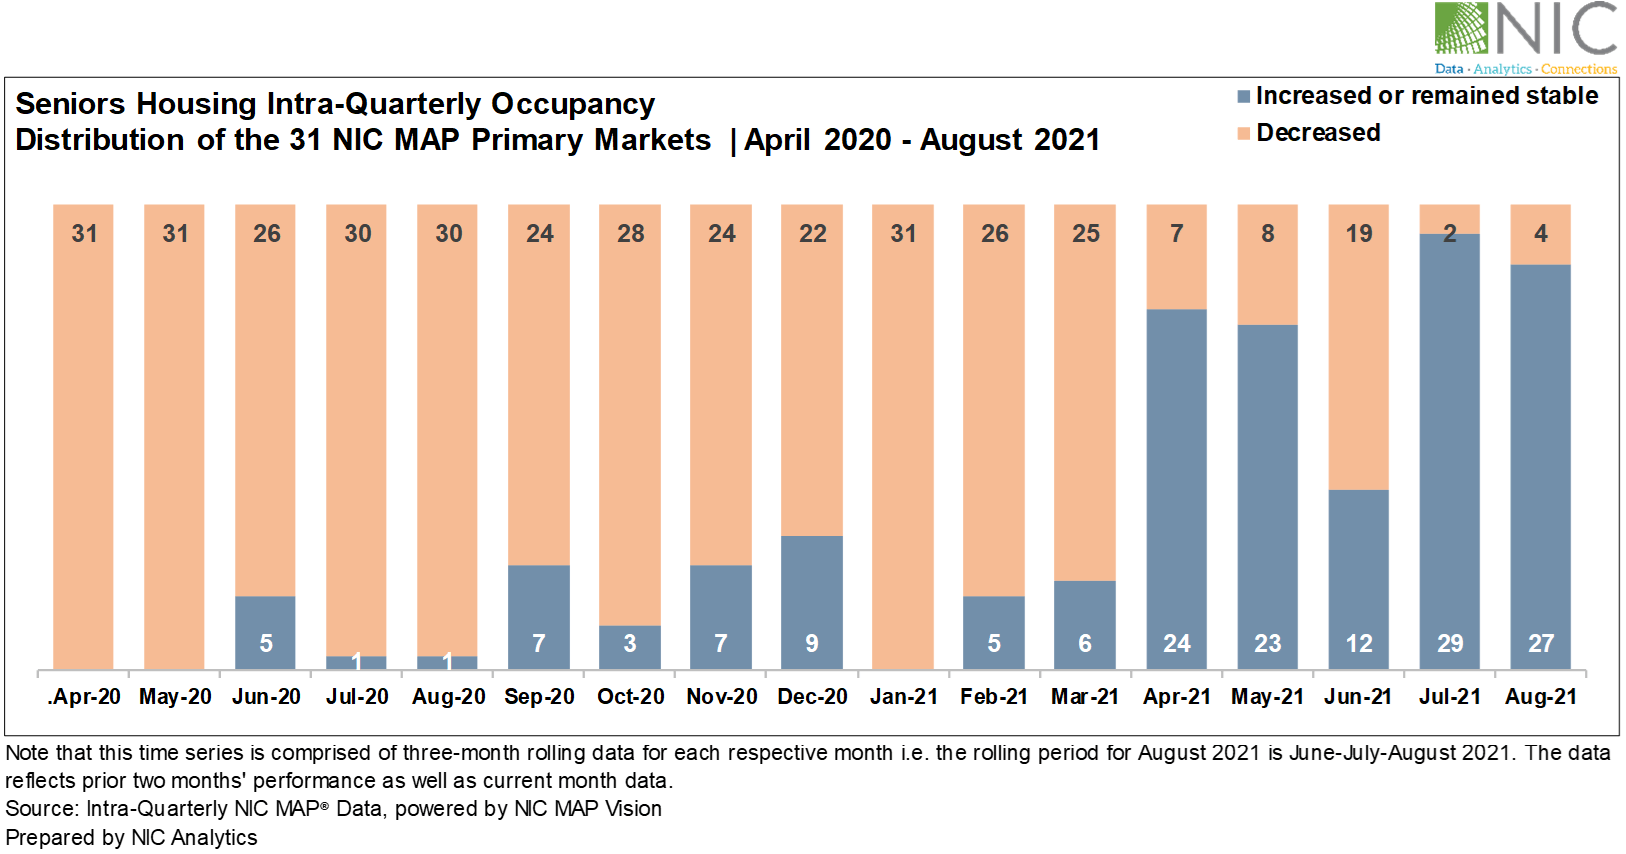
Exhibit 1 below shows that between the reporting periods of April 2020 and March 2021, seniors housing occupancy decreased across most of the NIC MAP 31 Primary Markets, if not all. However, and similar to the annual absorption trend depicted in Exhibit 1, the pattern reversed in April 2021, when seniors housing occupancy measured higher or stable compared with the prior month (reporting period) across most of the NIC MAP 31 Primary Markets.
Unexpectedly, the pattern changed in June 2021 but quickly skewed towards markets with increasing occupancy rates in July 2021. This change in June 2021 was largely due to new supply outstripping demand across some of the NIC MAP 31 Primary Markets. The most recent data show that in the August 2021 reporting period, occupancy increased or was unchanged in 27 of the 31 Primary Markets for seniors housing compared with July 2021, while only four markets saw a decrease in occupancy over the same period.
To learn more about inventory growth and how select NIC MAP metropolitan markets have performed in August 2021, download the August 2021 NIC Intra-Quarterly Snapshot Report.
Exhibit 1 – Seniors housing intra-quarterly occupancy distribution

Interested in learning more about NIC MAP data? To learn more about NIC MAP data, powered by NIC MAP Vision, and about accessing the data featured in this article, schedule a meeting with a product expert today.
—-
This blog was originally published on NIC Notes.
About NIC
The National Investment Center for Seniors Housing & Care (NIC), a 501(c)(3) organization, works to enable access and choice by providing data, analytics, and connections that bring together investors and providers. The organization delivers the most trusted, objective, and timely insights and implications derived from its analytics, which benefit from NIC’s affiliation with NIC MAP Vision, the leading provider of comprehensive market data for senior housing and skilled nursing properties. NIC events, which include the industry’s premiere conferences, provide sector stakeholders with opportunities to convene, network, and drive thought-leadership through high-quality educational programming. To see all that NIC offers, visit nic.org.
NIC MAP Vision gives operators, lenders, investors, developers, and owners unparalleled market data for the seniors housing and care sector.
