NIC MAP Vision 2Q23 Key Takeaways: Eighth Consecutive Quarter of Senior Housing Occupancy Gains
September 18, 2023
NIC MAP Vision clients, with access to NIC MAP® data, attended a webinar in mid-July on key senior housing data trends during the second quarter of 2023. Findings were presented by the NIC Analytics research team. Key takeaways included the following:
Takeaway #1: Senior Housing Occupancy Rose 0.6 Percentage Points in 2Q 2023
- The occupancy rate for senior housing—where senior housing is defined as the combination of the majority independent living and assisted living property types—rose 0.6 percentage points to 83.7% from the first quarter of 2023 to the second quarter for the 31 NIC MAP Primary Markets. This marked the eighth consecutive quarter of occupancy increases, so we have now seen two years of occupancy gains.
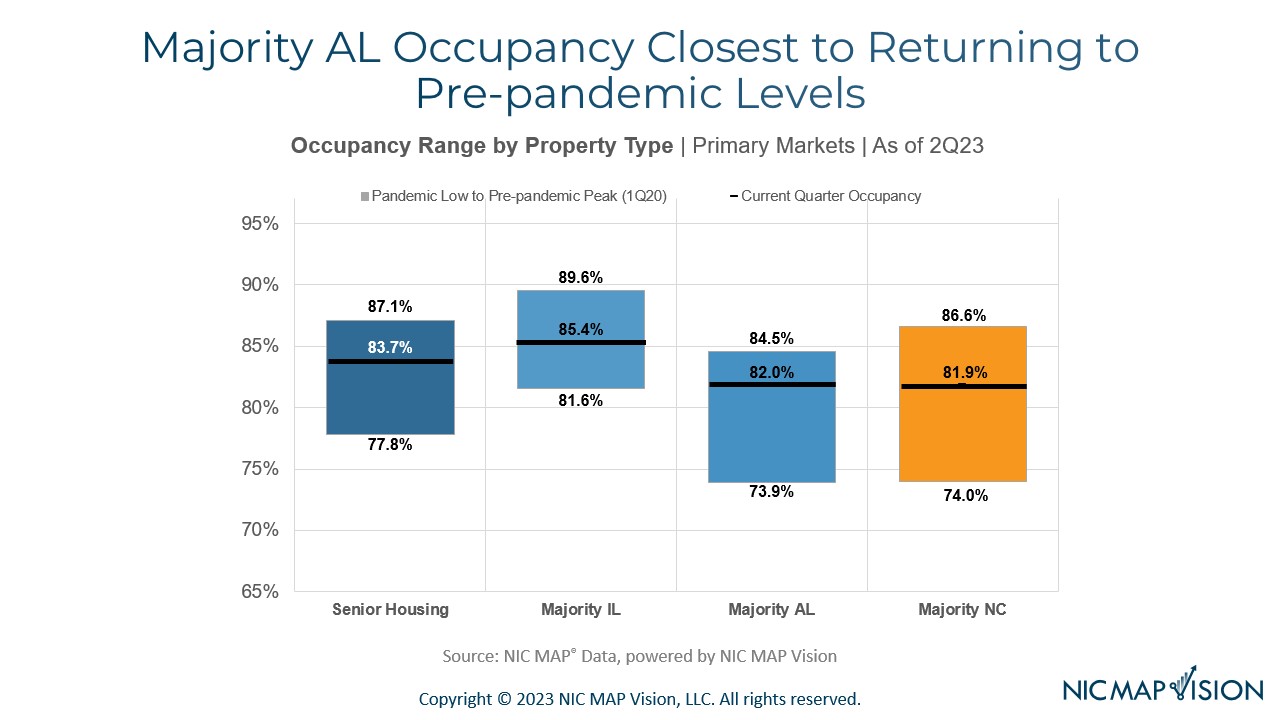
- At 83.7%, occupancy was 5.9 percentage points above its pandemic-related low of 77.8% recorded in the second quarter of 2021 and was 3.4 percentage points below its pre-pandemic level of 87.1% of the first quarter of 2020.
- Demand as measured by the change in occupied inventory or net absorption totaled nearly 5,100 units in the Primary Markets. Demand has been positive over the past nine quarters, which has helped occupancy to improve.
Takeaway #2: Majority Assisted Living Occupancy Closest to Returning to Pre-Pandemic Levels
- The chart below shows the pace of recovery to date for each property type and the gap remaining to reach pre-pandemic 1Q 2020 occupancy levels.
- Assisted living has recovered roughly three-fourths of its occupancy losses, while nursing care has recovered nearly two-thirds of its occupancy losses, and each had a second quarter occupancy rate of approximately 82%.
- Independent living has recovered only half of its occupancy losses, but its current occupancy rate is still highest among these segments.

Takeaway #3: 2Q23 Inventory Growth Lowest in the Time Series
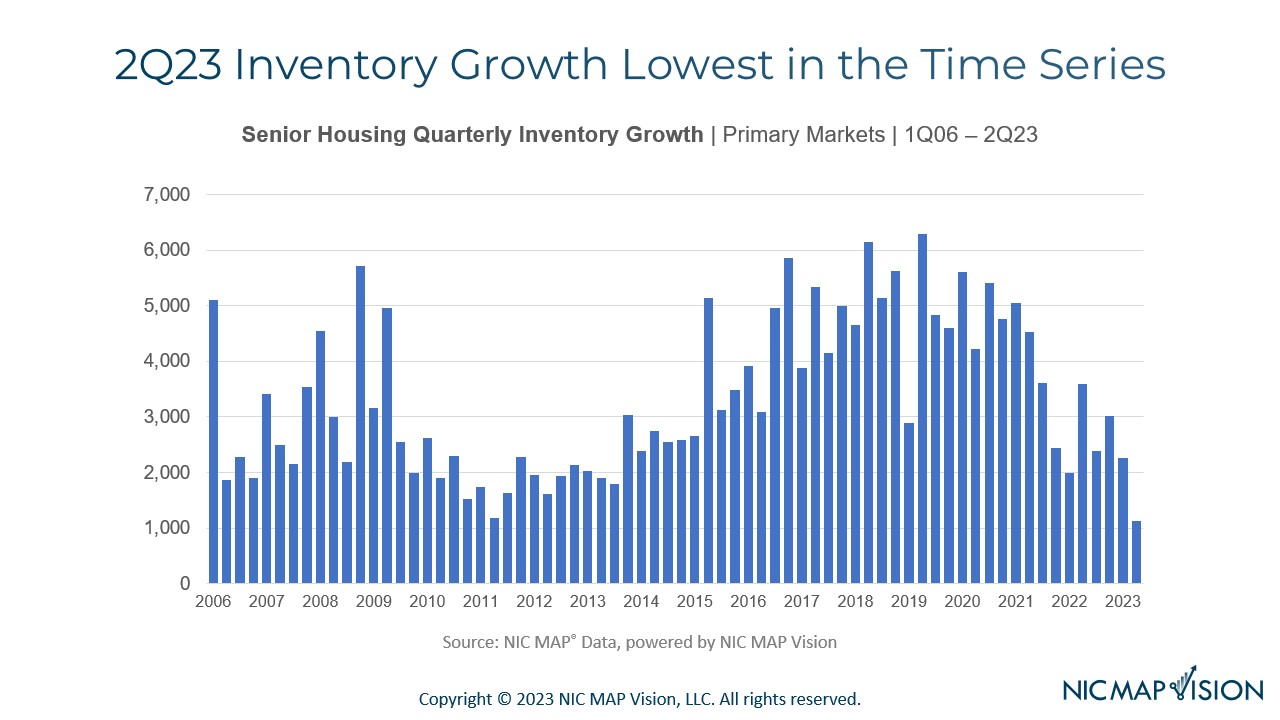
- Inventory growth continued to be relatively slow, increasing by roughly 1,100 units in the second quarter, which was the lowest level observed since the beginning of the time series in 2006.
- As you can see in the chart below, inventory growth has generally trended down from its high point of nearly 6,300 units in mid-2019.
Takeaway #4: Units Under Construction Least Since 2015
- The number of senior housing units under construction in the 31 NIC MAP Primary Markets also continued to decline and stood at 34,401 units in the second quarter of 2023, which was its lowest level since 2015.
- Since 2011, the number of units under construction for assisted living has exceeded the number for independent living. In recent quarters, however, the gap between the two property types has narrowed with Majority Assisted Living comprising 52% of units under construction in the second quarter of 2023 and Majority Independent Living comprising 48%, so each made up roughly half of construction. In comparison, Majority Assisted Living comprised more than 70% of units under construction in 2013, which was its peak share.
- For assisted living, there were a bit under 18,000 units under construction. As a share of existing inventory, this totaled 5.2% which was well below its peak of 10.2% in 2017.
- For independent living, there were 16,500 units under construction in the second quarter, equal to 4.6% of existing inventory and down from its peak of 6.5% in 1Q 2020.
- Overall, while construction has slowed sharply from its peak levels, there is still construction underway. Furthermore, much of it is concentrated within several individual metro markets.
Interested in learning more?
The data featured in this article derives from NIC’s analysis of NIC MAP Vision’s Senior Housing Market Fundamentals Data Release. NIC MAP Vision clients with access to NIC MAP data also receive an exclusive invitation to a market fundamentals webinar led by NIC’s Research team where they review each quarter’s trends in context with historical data and current events. To get a better idea of what’s covered, watch an abridged version of the webinar. To learn more about NIC MAP data, powered by NIC MAP Vision, and accessing the data featured in this article, schedule a meeting with a product expert today.
NIC MAP Vision gives operators, lenders, investors, developers, and owners unparalleled market data for the seniors housing and care sector.

