Beyond 3%: Unpacking Senior Housing’s Rate Increase Reality
In the senior housing industry, understanding the dynamics of rental rate increases is crucial for stakeholders to make informed decisions. Traditionally, a 3% annual increase has been the benchmark within the sector. However, recent data suggests that the real picture is far more nuanced. This blog delves into the latest findings from NIC MAP, the leading provider of seniors housing and care data and services, to unpack these trends and offer a clearer perspective on the state of rate increases in senior housing.
Historical Norms and the Pandemic’s Impact
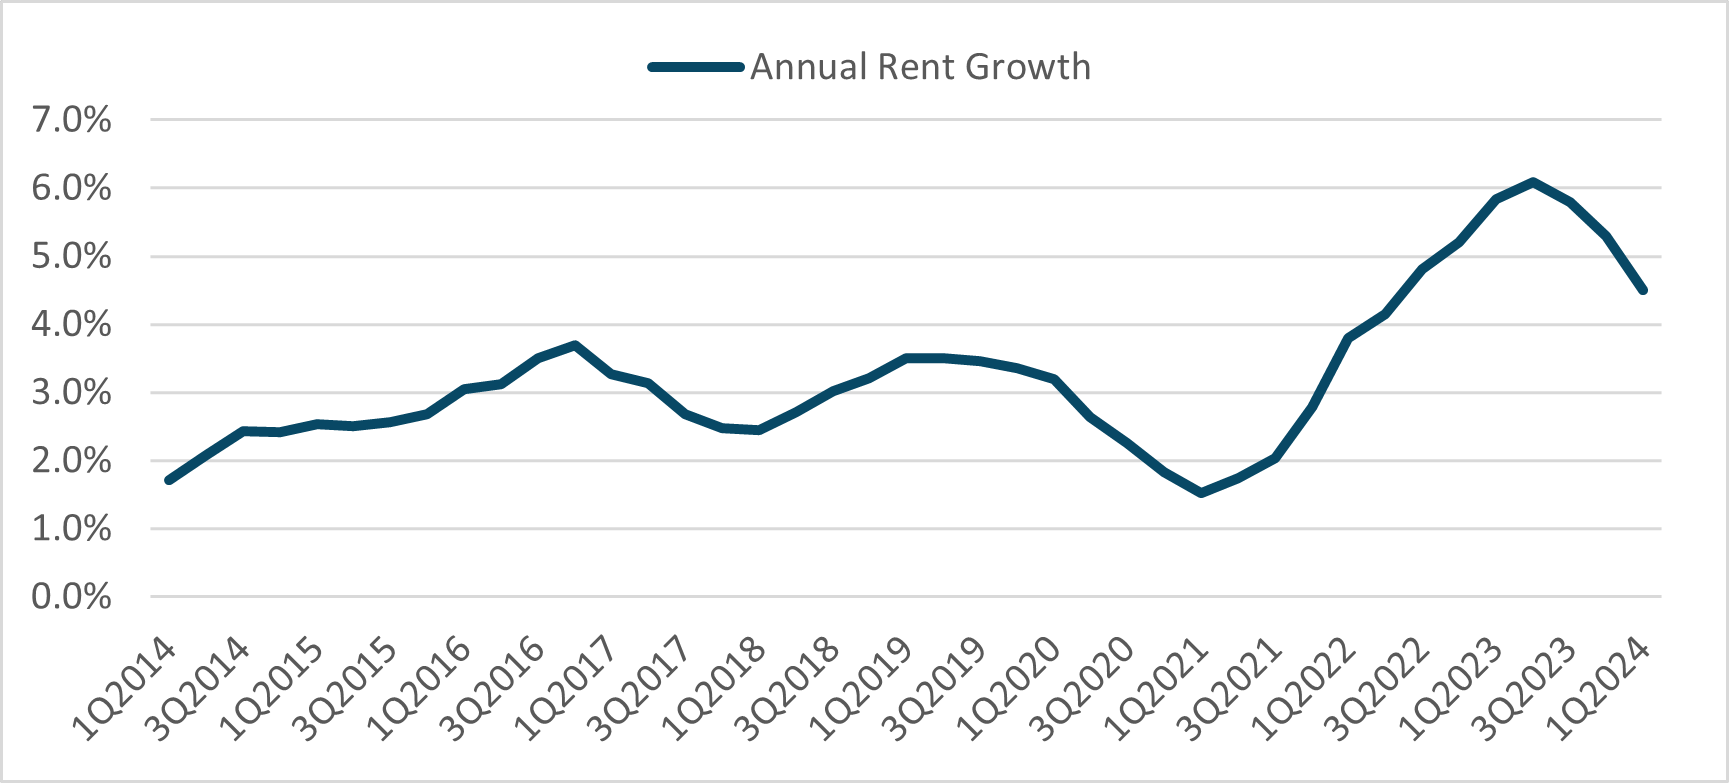
Prior to the COVID-19 pandemic, senior housing rent increases typically ranged from 2.5% to 3.7% annually, as per NIC MAP’s extensive data tracking from 2016 through 2019. This steady rate represented the general expectation across the industry for annual adjustments. However, the pandemic introduced significant volatility into the market, driving rates higher due to increased operational costs and fluctuating occupancy levels. As of the first quarter of 2024, though the annual rate increase for senior housing stands at 4.5%, it remains above historical norms but shows signs of deceleration.
The Barbell Effect in Rate Increases
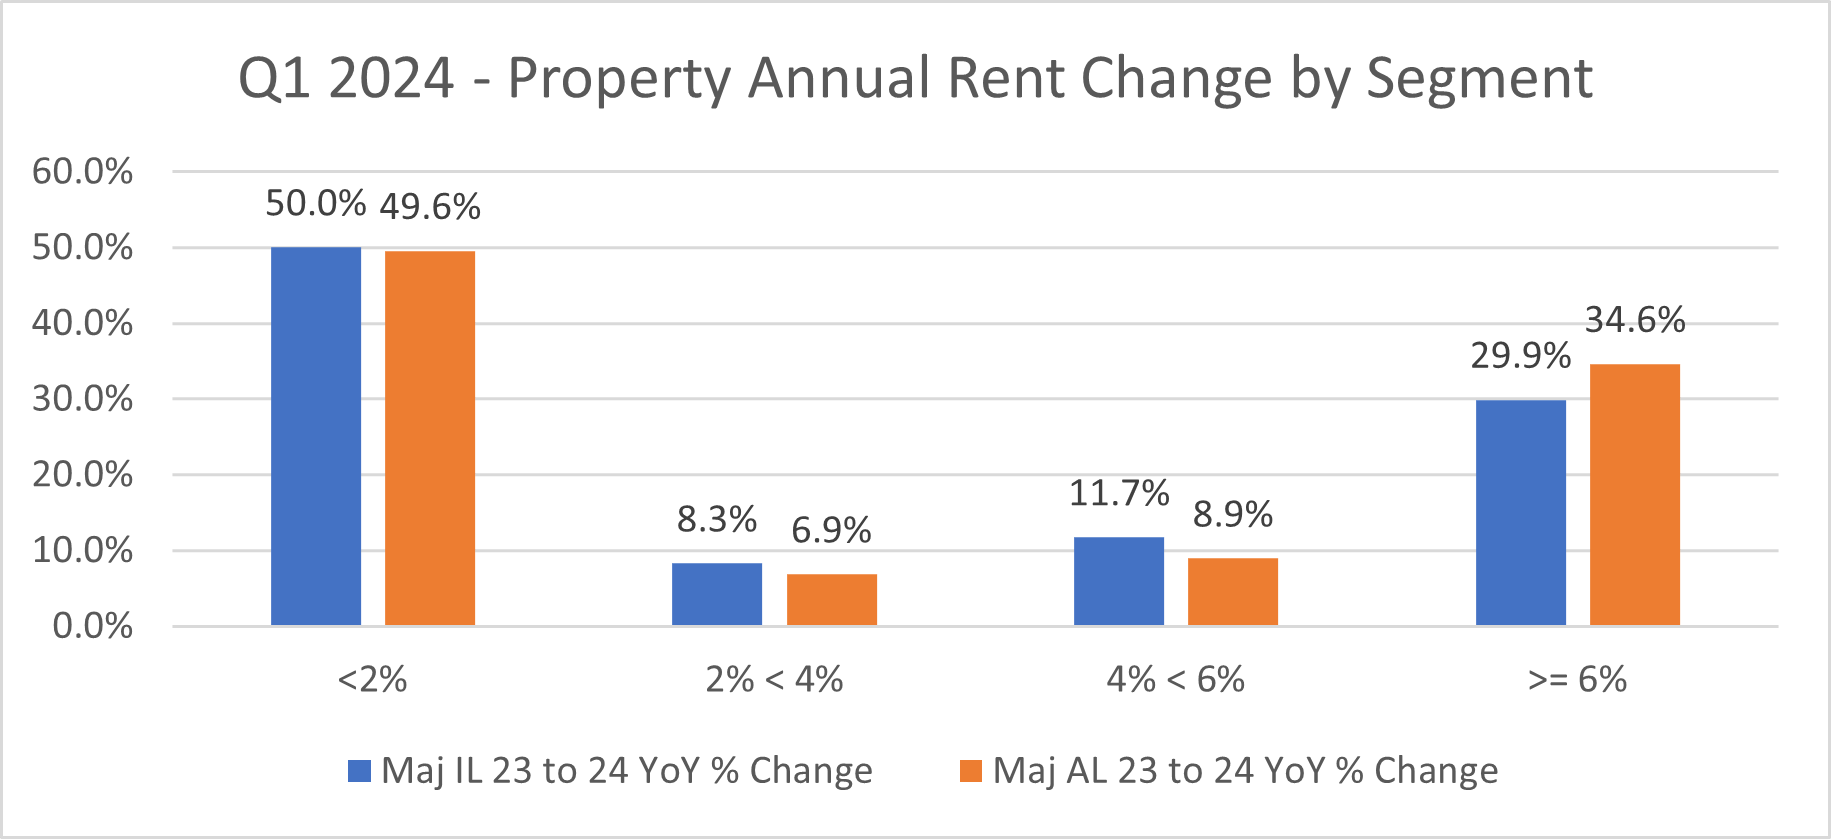
Our analysis shows the identification of a barbell effect in rate increases at the property level. This effect challenges the traditional view of a uniform 3% increase across the board. Data from the first quarter of 2024 indicates a polarized distribution of rate increases:
- Less than 2% Increase: Approximately half of the properties in both majority independent living and assisted living sectors experienced less than a 2% increase. Notably, many of these properties also reported similar low increases in the previous year.
- Minimal Middle Ground: Surprisingly, less than 8% of properties fell into the expected 2% to 4% increase range, which would align with the industry’s perceived standard.
- More than 6% Increase: Around 30% of properties saw rate increases exceeding 6%, with about 40% of these properties also experiencing similar hikes in the prior year.
These findings illustrate that while the average might hover around 3%, the actual change can vary significantly, influenced by the individual property’s performance, local market conditions, operational efficiencies, and varying management strategies.
Implications for the Senior Housing Industry
Resetting Expectations
- The data suggests a reset in the industry’s expectations regarding rate increases. Stakeholders must recognize that each property is unique and influenced by its specific market, occupancy rates, and financial health. Generalizing a 3% increase across all properties can lead to misaligned strategies and expectations.
Stratification of Property Performance
- The variability in rate increases also highlights a growing stratification between high and low-performing properties. High-performing communities, often in desirable locations with superior amenities and services, can command much higher rate increases. This disparity underscores the importance of competitive positioning and investment in quality to attract discerning consumers.
Consumer Trends
- The willingness of consumers to accept higher rate increases for premium senior living experiences points to a strong demand within the sector. This trend suggests that investment in enhancing community features, resident services, and overall living conditions can justify higher rent increases, thereby benefiting both operators and residents.
Conclusion
The landscape of rate increases in senior housing is complex and influenced by a multitude of factors that extend beyond a simple percentage change. NIC MAP’s data provides an invaluable resource for understanding these dynamics, allowing industry players to better navigate the challenges and opportunities in adjusting rental rates. As the market continues to evolve, particularly in the wake of the pandemic’s lingering effects, leveraging detailed, property-level data will be crucial in shaping effective strategies and meeting consumer expectations in the competitive senior living market.


