Cautious Optimism: Occupancy Rates Appear to Have Hit Bottom
June 10, 2021
While it is still early to say if the seniors housing and care market is showing strong and durable signs of a recovery, several indicators from the NIC MAP® Data, powered by NIC MAP Vision, and from NIC Analytics have sparked cautious optimism and suggest that we may be at least at the bottom of the cycle. Occupancy rates may have reached the low point in February and March of 2021; however, the outlook for when occupancy will return to pre-pandemic levels remains a question.
In this blog, we look at four indicators from NIC MAP data and NIC Analytics that measure occupancy, move-ins and move-outs, overall demand, and lead volumes, which all do seem to point to modest signs of inflection and portray the sector’s current level of performance.
Top Findings:
-
The just released NIC Intra-Quarterly Snapshot shared the latest reported NIC MAP data. This data showed that the occupancy rate for seniors housing edged up 0.3 percentage points in the May 2021 reporting period for the NIC MAP Primary Markets on a three-month rolling basis above its all-time low of 78.7% in the March 2021 reporting period, but it remained very low by historic standards.
-
NIC MAP intra-quarterly data showed that majority nursing care (NC) properties had the largest increase in occupancy since March 2021 reporting period, up 70 basis points (bps) but at 74.7%, it is still 11.9 percentage points (pps) below the pre-pandemic March 2020 level.
-
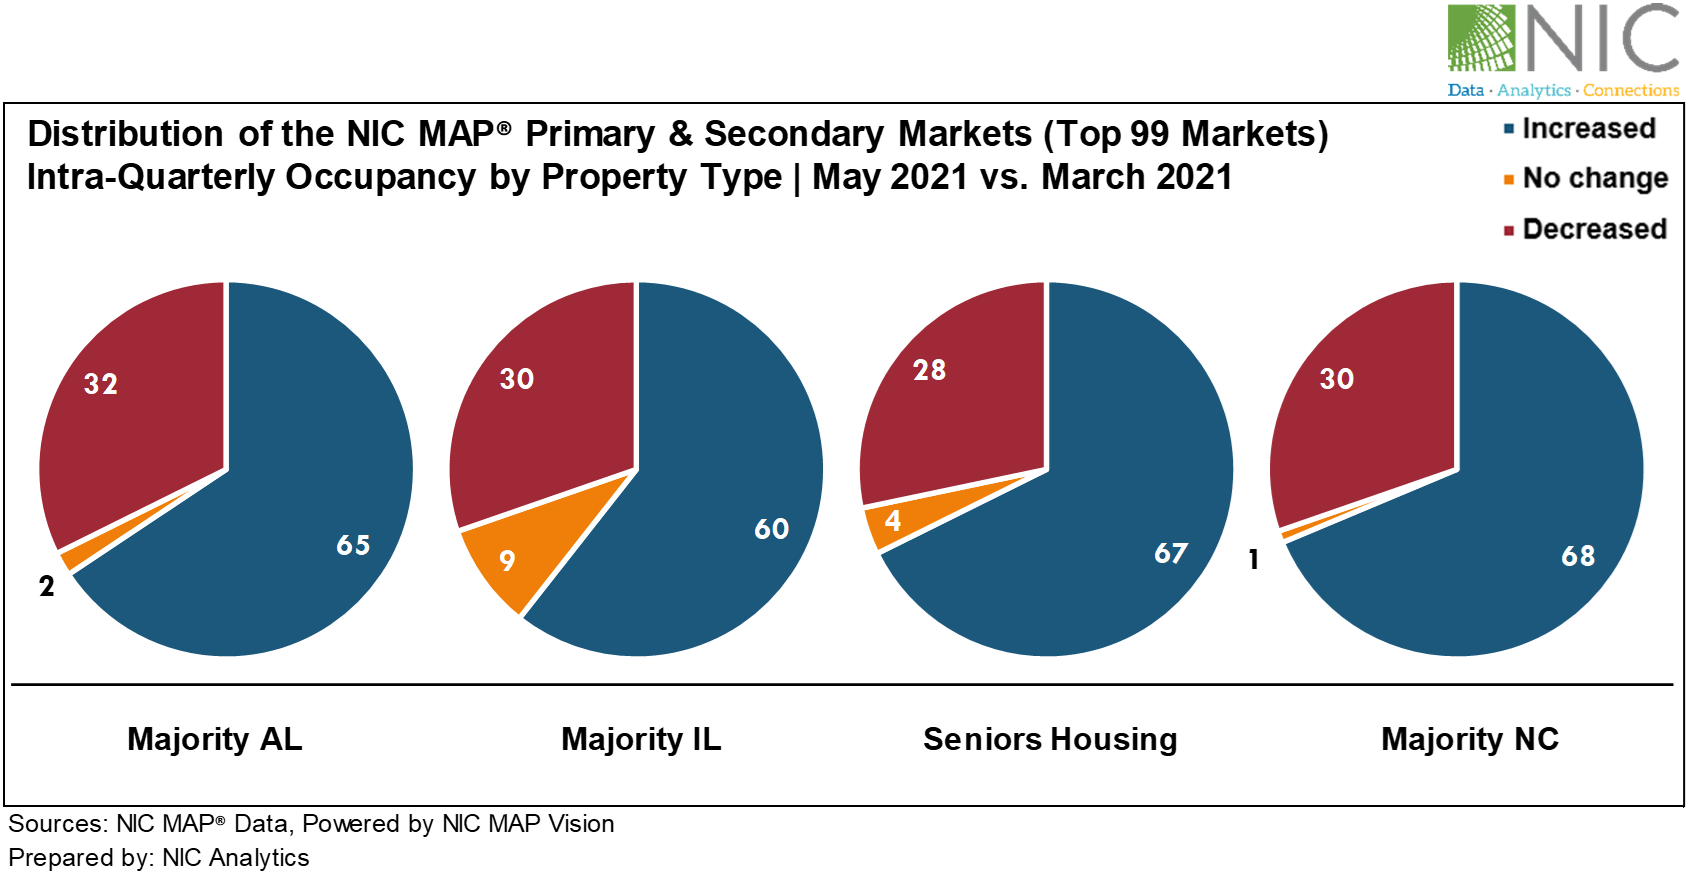
Sixty-seven of the 99 NIC MAP Primary & Secondary Markets for seniors housing saw an increase in occupancy since March 2021. Over the same period, sixty-eight markets for majority nursing care experienced an increase in occupancy rates, according to May 2021 NIC MAP intra-quarterly data.
-
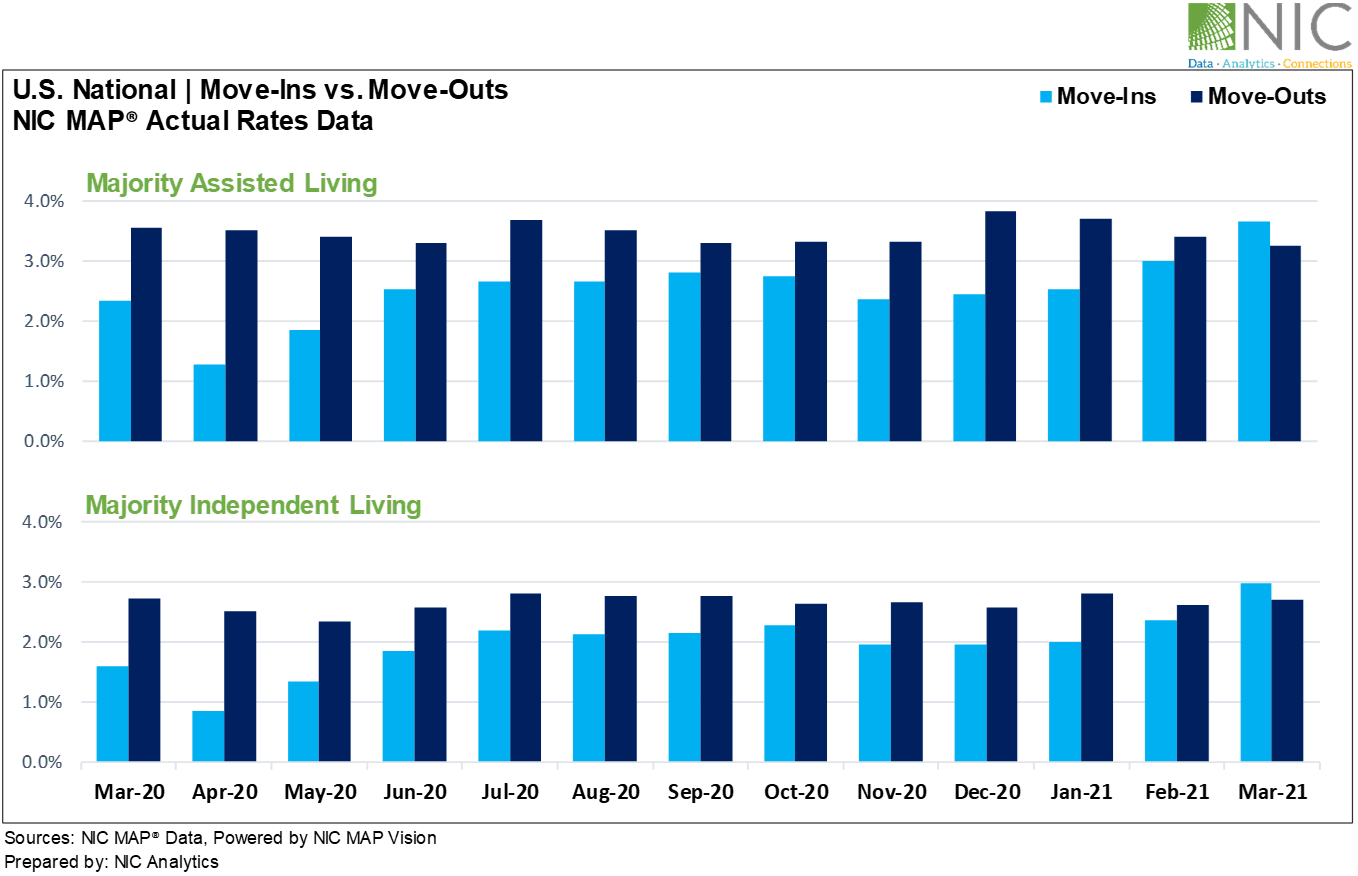
The NIC MAP Actual Rates Report showed that move-ins reached new highs in March 2021 for both majority independent living and majority assisted living since NIC began reporting actual rates data in 2015.
-
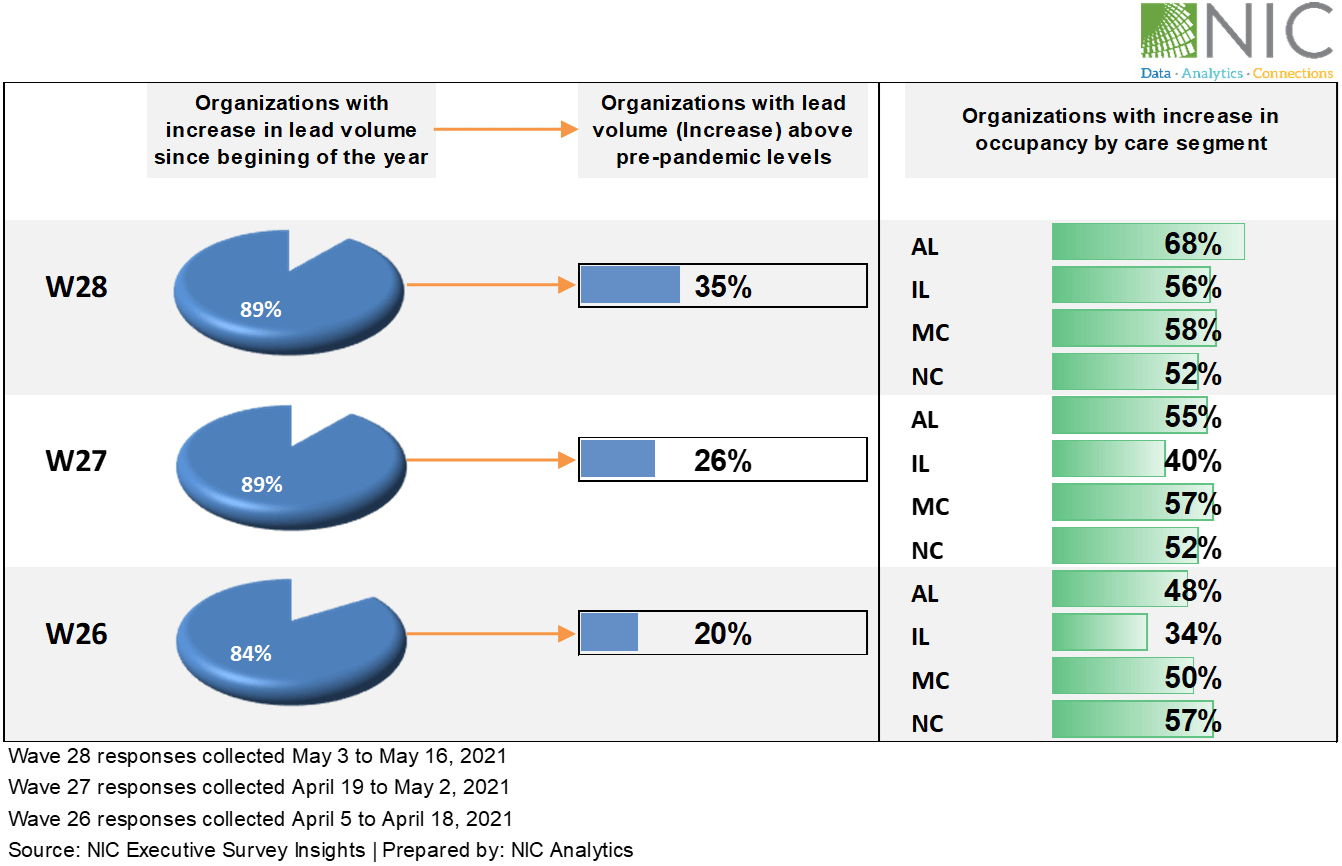
Wave 28 of NIC Executive Survey Insights also reported lead volumes increasing and move-ins accelerating for some survey respondents, resulting in gains in occupancy for more than 50% of respondents.
-
The NIC MAP Skilled Nursing Monthly Report, released by NIC MAP Vision, with data through March 2021 showed that skilled nursing property occupancy increased for a second month in a row. It increased 49 bps from February to end March at 71.6%. It is up 89 bps from the low set in January 2021.
NIC MAP Intra-Quarterly Data – As of May 2021
Exhibit 1 below depicts that the all-occupancy rate for seniors housing inched up 0.1 percentage point to 79.0% in the May 2021 reporting period for the NIC MAP Primary Markets on a three-month rolling basis from the April 2021 reporting period. This placed the occupancy rate 0.3 percentage points above its all-time low of 78.7% in the March 2021 reporting period, but it remained very low by historic standards. Prior to the pandemic in the March 2020 reporting period, occupancy was 87.5% — 8.5 percentage points higher than the most recent data point.
Since its low point in the March 2021 reporting period, the all-occupancy rate for majority assisted living (AL) was up 0.3 percentage points to 75.8% for the NIC MAP Primary Markets on a three-month rolling basis, although there was little change from the April 2021 reporting period. Majority independent living (IL) properties saw an increase of 0.2 percentage points since March 2021, with a gain of 0.1 percentage point in both April and May.
Majority nursing care (NC) properties had the largest increase in occupancy since March 2021 reporting period, up 70 bps but at 74.7%, it is still 11.9 pps below the pre-pandemic March 2020 level. The relatively large improvement shows the positive impact early inoculation has had on occupancy rates for majority nursing care properties. In addition, skilled nursing properties have benefitted from the resumption of elective surgeries at hospitals since recuperation and post-acute care from knee and hip surgeries often take place in skilled nursing settings.
The bottom line is that for the overall NIC MAP Primary Markets aggregate occupancy rate, no declines have been reported for two consecutive monthly reporting periods (April and May 2021) across all property types.
Exhibit 1 – Intra-Quarterly Occupancy by Reporting Period – Data as of May 2021
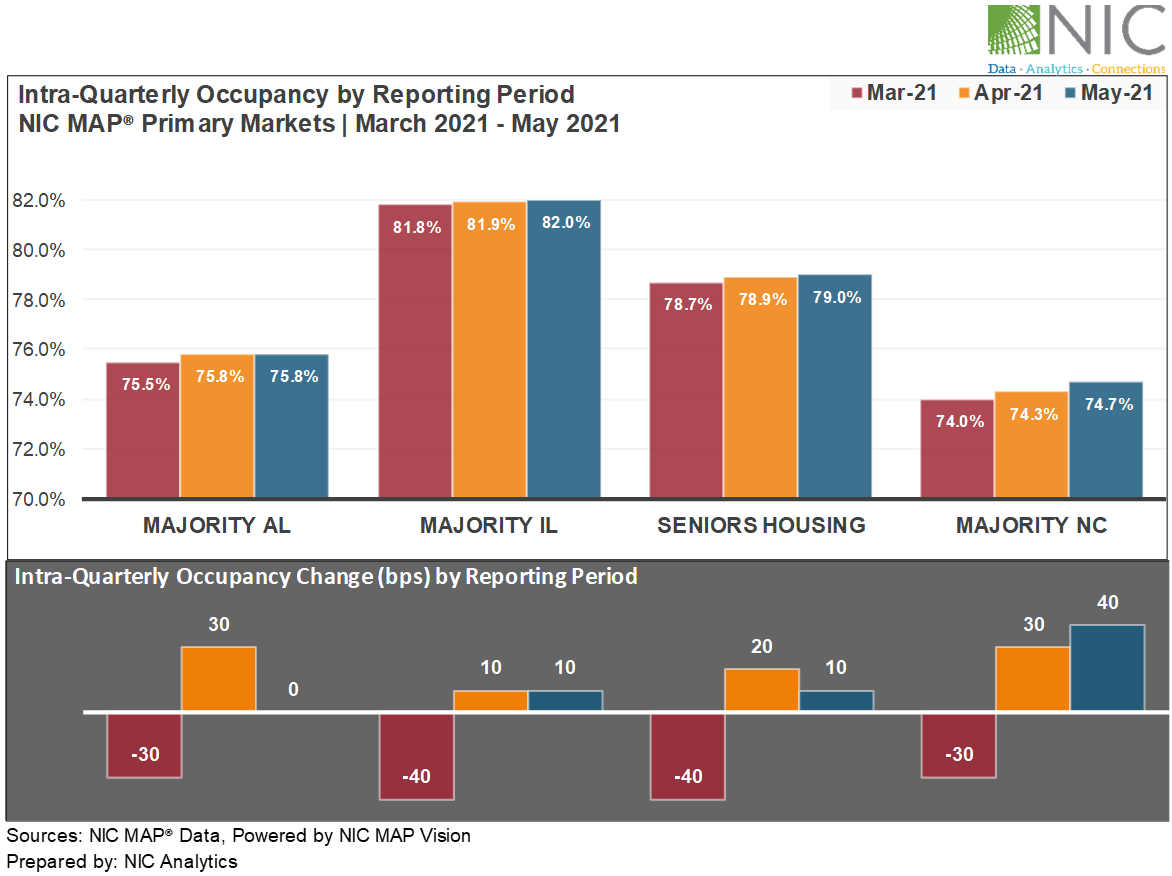
Exhibit 2 below shows that occupancy increased or remained stable in 65 of the 99 NIC MAP Primary & Secondary Markets for AL in the May 2021 reporting period compared to March 2021 levels. Thirty-two markets’ occupancy continued to slip further, and two remained stable.
For IL, 60 of the 99 Primary & Secondary Markets had higher occupancy rates in May 2021 compared to March 2021 levels.
Overall, 67 of the 99 NIC MAP Primary & Secondary Markets for seniors housing saw an increase in occupancy since March 2021. Over the same period, 68 markets for majority nursing care experienced an increase in occupancy rates.
Exhibit 2 – Distribution of the NIC MAP Primary & Secondary Markets (Top 99 Markets)
NIC MAP Seniors Housing Actual Rates Data – As of March 2021
The recently released 1Q2021 NIC MAP® Seniors Housing Actual Rates Report showed that for the first time since the pandemic unfolded in the U.S. and began to influence the seniors housing sector, move-ins outpaced move-outs for both majority independent living and majority assisted living, as shown in Exhibit 3.
Notably, move-ins reached new highs in March 2021 for both majority independent living (3.0%) and majority assisted living (3.7%) since NIC MAP began reporting actual rates data in 2015. This corroborates the increase in lead volume captured in NIC’s Executive Survey Insights, which has been reportedly above pre-pandemic levels for some data contributors.
Exhibit 3 – Majority Assisted Living and Majority Independent Living – Move-ins vs. Move-Outs
NIC Executive Survey Insights (Wave 28 Survey)
Wave 28 of NIC’s Executive Survey Insights also reported lead volumes increasing and move-ins accelerating for some survey respondents, resulting in gains in occupancy for more than 50% of respondents.
Exhibit 4 below depicts that since early April, respondents were asked if their organizations had seen an increase in resident lead volume since the beginning of the year and, if they had, if lead volume is above pre-pandemic levels. As shown in the chart below, about nine out of ten organizations reported an increase in lead volume (89%). Additionally, one-third of organizations report lead volume currently above pre-pandemic levels (35%) compared to 20% in Wave 26 conducted just one month prior. Regardless of reports of notable improvement in lead volume, nearly two-thirds of survey respondents expect their organizations’ occupancy rates to recover to pre-pandemic levels sometime in 2022. This sentiment has remained consistent since first reported in late February (Wave 23). In fact, roughly 50% to 70% reported upward changes in occupancy in the Wave 28 survey.
Exhibit 4 – Lead Volume and Occupancy by Care Segment According to Data Compiled by NIC Executive Survey Insights (Wave 28 survey)
NIC Skilled Nursing Data Initiative – Data as of March 2021
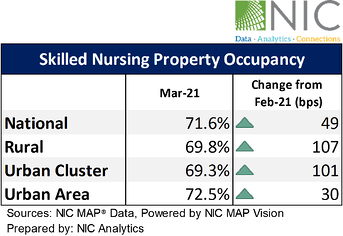
The NIC MAP Skilled Nursing Monthly Report released by NIC MAP Vision, with data through March 2021, showed that skilled nursing property occupancy increased for a second month in a row. As shown in Exhibit 5 below, it increased 49 bps from February to end March at 71.6%. It is up 89 bpsfrom the low set in January 2021. The expectation was occupancy would increase given the decline in COVID-19 cases across the country. Although occupancy seems to have stabilized, it remains very low compared to pre-pandemic levels. It is 13.2 percentage points below the February 2020 occupancy when it was 84.8%.
Nursing care properties in urban areas reported the highest occupancy rate in March 2021 at 72.5%, followed by rural (69.8%) and urban clusters at 69.3%. The largest increase in occupancy has been reported in rural, up 107 bps from February 2021 levels.
Exhibit 5 – Skilled Nursing Property Occupancy – Data as of March 2021
These signs are promising and suggest that positive demand is returning. The full recovery from the COVID-19 crisis, however, will likely not be immediate or fast. Operators have not only suffered significant losses due to the COVID-19 pandemic but also had to navigate through the COVID-19-related recession amid slowing rates of move-ins and rising operating expenses to protect their residents. While some entire industries shut down such as restaurants, seniors housing remained open despite a host of proliferating challenges related to PPE, testing, infection control, staffing challenges, a patchwork of disparate regulations, lockdowns, limits on visitation, and social distancing. This agility, in and of itself, shows the resilience and endurance of the seniors housing market through the pandemic.
Thanks to the way vaccines have been distributed and administered, prioritizing the population most vulnerable to the virus, namely older Americans and residents of skilled nursing and seniors housing properties, COVID-19 cases in the U.S. have fallen to levels not seen since March 2020 and virus cases in skilled nursing properties dropped to lowest point in pandemic, according to CMS data compiled by NIC’s Skilled Nursing COVID-19 Tracker. The positive impact early vaccinations have had on the sector started to translate into positive demand, higher lead volumes, and improvements in occupancy rates.
With 15 years’ hindsight, the seniors housing market plays a critical role in supporting and helping America’s seniors age comfortably. The pandemic has revealed hidden and long-standing weaknesses, but also presented enormous opportunities for innovation and growth. Consumer demand and housing needs may have changed but the value proposition of seniors housing care settings in the post-pandemic world have strengthened. High quality care is essential for continuum of care in seniors housing. However, a sense of belonging, socialization, and engagement are the value propositions of a continuum of wellness. This will lead to a healthier resident outcome, a stronger seniors housing market, and a faster recovery for the sector, especially, as demand and the population of seniors increase and the baby boomer generation ages.
Looking ahead with any certainty is always difficult, but there is an air of cautious optimism regarding the future trajectory of seniors housing. The industry will recover if for no other reason than the fact that the industry’s value proposition and product offerings are critical for care and housing options for today’s older adult population as well as for America’s rapidly aging population. Today’s oldest baby boomer is 75 and quickly approaching the age of needing seniors housing (age 82 or more). Additionally, the sector offers compelling and emerging opportunities in both healthcare collaboration and population health management, as evidenced by the pandemic, and as critically needed to stave off staggering societal healthcare costs. And lastly, there is a better understanding of the sector by institutional capital providers who hold significant amounts of investable and targeted capital.
Interested in learning more about NIC MAP data? To learn more about NIC MAP data, powered by NIC MAP Vision, and about accessing the data featured in this article, schedule a meeting with a product expert today.
About Beth Mace and Omar Zahraoui
Beth Burnham Mace is the Chief Economist and Director of Outreach at the National Investment Center for Seniors Housing & Care (NIC). Prior to joining the staff at NIC, she served as a member of the NIC Board of Directors for 7 years and chaired NIC’s Research Committee. Ms. Mace was also a Director at AEW Capital Management and worked in the AEW Research Group for 17 years. While at AEW, Ms. Mace provided primary research support to the organization’s core and value-added investment strategies and provided research-related underwriting in acquisition activity and asset and portfolio management decisions. Prior to joining AEW in 1997, Ms. Mace spent ten years at Standard & Poor’s DRI/McGraw-Hill as the Director of the Regional Information Service with responsibility for developing forecasts of economic, demographic, and industry indicators for 314 major metropolitan areas in the U.S. Prior to working at DRI, she spent three years as a Regional Economist at the Crocker Bank in San Francisco. Ms. Mace has also worked at the National Commission on Air Quality, the Brookings Institution and Boston Edison. Ms. Mace is a member of the National Association of Business Economists (NABE), ULI’s Senior Housing Council, the Urban Land Institute and New England Women in Real Estate (NEWIRE/CREW). In 2014, she was appointed a fellow at the Homer Hoyt Institute and was awarded the title of a “Woman of Influence” in commercial real estate by Real Estate Forum Magazine and Globe Street. Ms. Mace is a graduate of Mount Holyoke College (B.A.) and the University of California (M.S.). She has also earned The Certified Business Economist™ (CBE), which is the certification in business economics and data analytics developed by NABE. The CBE documents a professional’s accomplishment, experience, abilities, and demonstrates mastery of the body of knowledge critical in the field of economics and data analytics. Omar Zahraoui, a data analyst at the National Investment Center for Seniors Housing & Care (NIC), is a seniors housing research professional with expertise in providing quantitative analysis and insights on seniors housing & care market data; building new products and reporting capabilities, including dashboards and proformas for clients and internal stakeholders; and implementing new processes and data solutions. Prior to his current role, Omar worked as a data analyst, at Calpine Corporation, supporting the development of new-business strategy initiatives, analyzing sales and financial data, and developing statistical modeling of consumers’ behaviors to drive business performance. Omar holds a Bachelor’s degree in Business Administration with concentrations in Finance and Management, a Master in Corporate Finance from IAE Lyon School of Management at Jean Moulin Lyon III University in France, and a Master of Science in Management Information Systems and Data Analytics from Pace University.
—-
This blog was originally published on NIC Notes.
About NIC
The National Investment Center for Seniors Housing & Care (NIC), a 501(c)(3) organization, works to enable access and choice by providing data, analytics, and connections that bring together investors and providers. The organization delivers the most trusted, objective, and timely insights and implications derived from its analytics, which benefit from NIC’s affiliation with NIC MAP Vision, the leading provider of comprehensive market data for senior housing and skilled nursing properties. NIC events, which include the industry’s premiere conferences, provide sector stakeholders with opportunities to convene, network, and drive thought-leadership through high-quality educational programming. To see all that NIC offers, visit nic.org.
NIC MAP Vision gives operators, lenders, investors, developers, and owners unparalleled market data for the seniors housing and care sector.
